Inductively Coupled
Plasma Atomic Emission Spectroscopy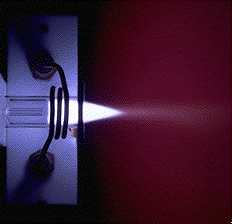 |
||||
| ICP - AES
Introduction |
Atomic Emission Spectroscopy with an ICP |
Atomic Excitation and Spectral Line Production |
Inductive
Heating and Plasma Production |
ICP
- AES Classroom Application |
|
Atomic Spectroscopy Atomic
Spectroscopy in it broadest sense is the study of the interaction of
electromagnetic radiation with matter. Some might argue that
atomic spectroscopy was born in 1966 when Sir Issac Newton discovered
that light can be separated into a continuous series of colors by
passing light through a prism. He subsequently called this
separation of light into its component colors a "spectrum" (3). Although he is not
credited with its invention, Newton's
experimentation with light essentially involved the creation of a very
basic spectroscope - the fundamental tool used in atomic emission
spectroscopy.
Atomic Emission Spectroscopy
Atomic emission spectroscopy is the study of the electromagnetic radiation emitted from matter (elements, compounds, molecules, etc...) when matter is excited by an excitation source. Atomic emission spectroscopy has its origins in the flame test in that a burning flame was one of the first excitation sources used to generate the emission of light from matter (2, 4). The flame test involves placing a sample to be tested into a burning flame and observing the light emitted from the sample. The burning flame is referred to as an excitation source because the energy being released from the chemical reaction occurring in the region of the flame is what causes the excitation of the atoms and/or molecules that are being introduced into the flame (the test sample). There are a number of different types of excitation sources used in atomic emission spectroscopy. The primary emission sources used in atomic emission spectroscopy today are the following (2): 1. AC or DC arcs 2. High, medium or low voltage sparks 3. Glow discharges with flat or hollow cathode 4. Inductively coupled plasmas 5. Lasers 6. Direct Current Plasmas 7. Capacitively coupled microwave plasmas 8. Microwave induced plasmas 9. Furnaces 10. Exploding wires or foils. Inductively coupled plasmas have grown in popularity in analytical spectroscopy because the inductively coupled plasma offers advantages over other excitation source options. Attempting to explain all of the advantages that ICP offers over each of the other excitation sources listed above would take away from the main focus of this site which is to explain how ICP - AES works, so it will not be attempted. A simple explanation as to why ICP is advantageous to use is that the design of the excitation source and the temperatures achieved in the plasma allow for a more efficient interaction between the sample being studied and the excitation source which leads to greater sensitivity, greater accuracy, greater precision, and greater atomic excitation. The basic sequence in the process of atomic emission spectroscopy is illustrated in Figure 1. Figure 1:
Stepwise Sequence in Atomic Emission Spectroscopy
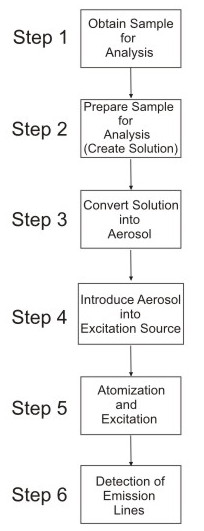 Step 1:
Atomic
emission spectroscopy is used for the determination of the elemental
composition of substances. The sample to be tested could come
from any number of sources. Common applications of atomic
emission spectroscopy are in the analysis of trace elements in soils,
water, metals, biological specimens, clinical specimens, food, physical
evidence such as glass, and other solids.
Step 2:
Each
sample to be tested in ICP-AES must be prepared for analysis and this
most commonly involves dissolving the sample into an aqueous or organic
solvent. It is possible to analyze solid samples with ICP-AES and
the technique used to do so depends on the solid being analyzed.
Some of the techniques used in the analysis of solid samples include
mechanical agitation of powders, arcs and sparks, and laser ablation.Step 3 & 4:
When
analyzing a liquid solution it is necessary to convert the solution
into an aerosol before introducing the sample into the excitation
source. This aids in the atomization process as well as increases
the intensity of spectral emissions. The aerosol is produced
immediately before the sample is forced into the excitation source such
as a plasma for the efficient production of atoms and spectral
emissions.Step 5:
The
sample typically enters the ICP in the form of a fine liquid
aerosol. There are various stages involved in the formation of
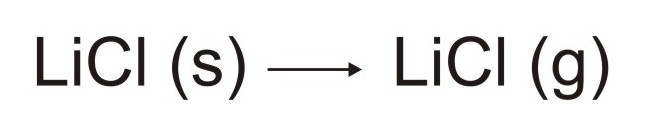
atoms. To illustrate the stages of atomization consider a
solution of lithium chloride. Lithium chloride (LiCl) will enter
the plasma and rapidly form a solid aerosol as illustrated below: The
solid aerosol will then vaporize to form gaseous "molecules" of lithium
chloride as illustrated below:
 The
gaseous lithium chloride will then decompose into lithium and chlorine
atoms as illustrated below.
 At
this point it is possible for the lithium and chlorine atoms to become
excited and/or ionized. Once the atoms become excited it is them
possible for them to emit light.
Step 6:
Once the atoms are emitting
light the light must be collected and detected. There are quite a
variety of ways to accomplish this task and the basic system required
to accomplish these goals involves an entrance slit; a collimator to
produce a parallel beam of light; a dispersing element such as a
diffraction grating or prism; a focusing element that reforms the
specific dispersed bands of light; and one or more exit slits to
isolate the desired spectral bands or band (Montaser and Golightly). Figure 2: Schematic
Diagram of Collimator Producing Parallel Beam of Light
Courtesy of Wikipedia Images 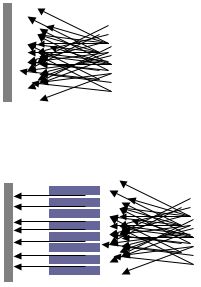 Figure 3:
Schematic Diagram of Paschen-Runge Mount
Taken from Inductively Coupled Plasmas in Analytical Atomic Spectrometry 2nd Edition by A. Montasar & D.W. Golightly 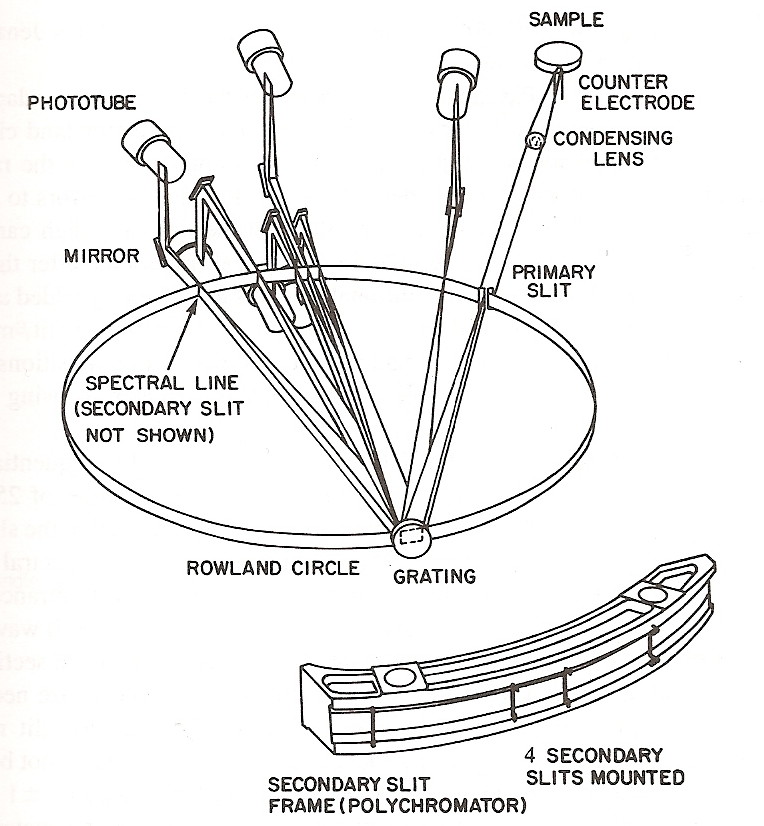 After passing through the exit slit the
light is detected by the electronic components of the
spectrophotometer. There are a number of different detection
systems that can be used in the spectrophotometer such as the photo
multiplier, vidicons, image dissectors, photodiode arrays (PDA), and
charge-coupled and charge-injection detectors (CCD & CID).
The photomultiplier contains a photoemissive cathode coated with an easily ionized material such as a cesium-antimony alloy (4). A photon striking the surface of the alloy will cause an electron to be emitted. This is essentially the basic premise behind the detector - converting the light emitted from the atoms into an electrical signal via the flow of electrons. The long wavelength detection limit of the photomultiplier is determined by the photon energy required to ionize the cathode in the tube. The short wavelength limit is determined by the material used to construct the light transmitting window of the photomultiplier tube. If quartz glass is used the shortest wavelength that can be detected is ~185 nm (5). Inductively
Coupled Plasma Atomic Emission Spectrophotometer
The instrument used in
inductively coupled plasma atomic emission spectroscopy is the ICP
spectrophotometer. The Environmental Science Department at the
University of Pennsylvania have their very own ICP spectrophotometer
various members of the department were kind
enough to let me come in and photograph the instrument. James
Bedison - a 3rd year PhD student at Penn - was kind enough to take some
time out of his day to give me some background information on the
instrument and explain how the ICP spectrophotometer pictured below
works.
Spectro-Genesis
ICP
Spectrophotometer at University of Pennsylvania
 The instrument used at the
University of Pennsylvania is called the Spectro-Genesis ICP AES and
has its own dedicated room. The room is small so I could only
photograph the instrument as a whole from the doorway (what you see
above is a side view of the instrument). In the picture above you
can see the auto sampler in the foreground. This is where the
analyst can line up trays of unknown samples to be analyzed as well as
known reference standards. The auto sampler is controlled by the
computer. The analyst must tell the computer how many samples are
in the trays as well as configure the instrument so that it will
recognize what it is that is being sampled. There are a number of
parameters that must be set before the sample is introduced into the
instrument.
Once the instrument has been configured, the samples to be analyzed can be introduced to the ICP instrument. The auto sampler removes the liquid samples from the sample tray via a thin capillary tube. The auto sampler and tube are pictured below. ICP Auto
Sampler
 The liquid sample is forced through a thin tube by a pneumatic pump into a spray chamber pictured below. The spray created in the spray chamber is forced up into the nebulizer where it is converted into an aerosol. The aerosol is introduced into the plasma via the glass plasma torch. The nebulizer used in the instrument at the University of Pennsylvania is a pneumatic concentric glass nebulizer. Sample
Introduction Components of Spectro-Genesis ICP
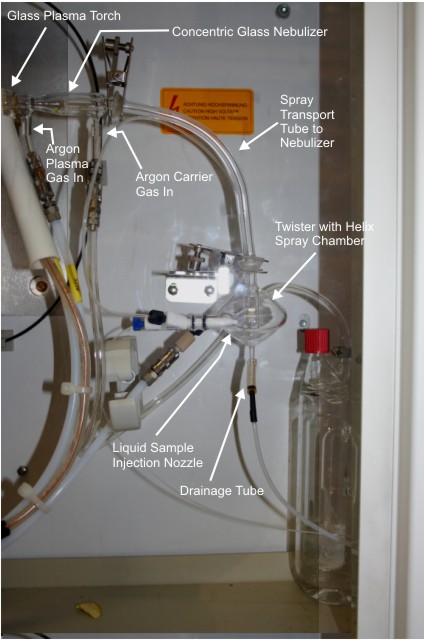 Figure 6.1: Sample Introduction Methods in
ICP-AES
Taken from Inductively Coupled Plasma Emission Spectroscopy-Part I, Chapter 5, by J. Broekart & P. Boumans  Liquids are introduced into
the plasma via the nebulizer. The purpose of using the nebulizer
is to break the liquid sample into an aerosol so that the sample to
analyzed is more rapidly analyzed. If the liquid sample were
injected directly into the plasma the atomization process would not be
as efficient and the sample may not have enough time to heat up to the
point where atomization occurs. The aerosol created by the
nebulizer is introduced to the plasma where the solvent is
evaporated. The molecules comprising the solvent are thermally
dissociated and the atoms comprising the molecules become partially
ionized (6). Before a
sample is analyzed the
ICP-AES must be calibrated with standard solutions so that a zero
emission reading can be obtained by the spectrophotometer.
The Plasma
Torch
The picture below is the
housing for the inductively coupled plasma torch.
Spectro-Genesis
ICP Plasma
Torch Housing
 If you were to open up the
housing and look inside you would see the plasma torch and the hollow,
water cooled, copper tubing responsible for generating and sustaining
the inductively coupled plasma. The is illustrated in the picture
below.
Spectro-Genesis
ICP Torch
 This is the location of
atomic excitation in the inductively coupled plasma atomic emission
spectrophotometer. This is where the plasma is generated and
where atomization and atomic excitation occurs.
The next section describes the details of atomic excitation and spectral line production. <- BACK NEXT -> |
||||
| References 1. Tetsuya,
H. Masao, U., Haraguchi, H. Hsiech, C, Montasar, A. Fundamental
Properties of Inductively Coupled Plasmas. In Inductively
Coupled Plasmas in Analytical Atomic Spectrometry
2nd Edition;
Montaser, A. and Golightly, D.W. Ed.;VCH Publishers Inc.: New York,
1992; pp 373-440.
2. Boumans, P. W. J. M. Introduction to Atomic Emission Spectrometery. In Inductively Coupled Plasma Emission Spectroscopy - Part I; Boumans P.W.J.M. Ed.;Wiley: New York, 1987; Vol. 90; pp 1-34. 3. MIT Spectroscopy. The Era of Classical Spectroscopy. The Spectral Nature of Light. http://web.mit.edu/spectroscopy/history/history-classical.html (accessed April 2008). 4. Metcalfe, E. Atomic Absorption and Emission Spectroscopy; Wiley: New York, 1991, Chapter 1. 5. Strasheim, A. and Montaser, A. Instrumentation fo Optical Emission Spectrometry. In Inductively Coupled Plasmas in Analytical Atomic Spectrometry 2nd Edition; Montaser, A. and Golightly, D.W. Ed.;VCH Publishers Inc.: New York, 1992; pp 109-185. 6. Broekaert, J. A. C. and Boumans, P. W. J. M. Sample Introduction Techniques in ICP-AES. In Inductively Coupled Plasma Emission Spectroscopy - Part I; Boumans P.W.J.M. Ed.;Wiley: New York, 1987; Vol. 90; pp 296 - 357. 7. Zumdahl, S. Chemical Principles 5th Edition; Houghton Mifflin: Boston, 2005, Chapter 12. 8. Electronic Structure and Atomic Orbitals. Jim Clark. www.chemguide.co.uk/basicorg/bonding/orbitals.html (accessed April 2008). 9. Ralchenko, Yu., Kramida, A.E., Reader, J., and NIST ASD Team (2008). NIST Atomic Spectra Database (version 3.1.5), [Online]. Available: http://physics.nist.gov/asd3 [2008, May 2]. National Institute of Standards and Technology, Gaithersburg, MD. NIST Atomic Spectra Database. Levels Data. http://physics.nist.gov/cgi-bin/ASD/energy1.pl (accessed April 2008). 10. Winge, R.K. et al. Inductively Coupled Plasma-Atomic Emission Spectroscopy: An Atlas of Spectral Information; Elsevier Science Publishers: New York, 1985, Appendix A-C. 11. Manning, T. and Grow, W. Inductively Coupled Plasma - Atomic Emission Spectroscopy. The Chemical Educator. [Online] 1997, vol 2, #1. http://www.mrl.ucsb.edu/mrl/centralfacilities/chemistry/icp.pdf (accessed April 2008). 12. Hyper Physics. Solenoid. Nave, R. http://hyperphysics.phy-astr.gsu.edu/hbase/magnetic/solenoid.html (accessed April 2008). |
||||
| Take Me Home | ||||